
RF ATMS
RF and Microwave switches are used extensively in microwave test systems for signal routing between instruments and Device under Test (DUT).
RF and Microwave switches are used extensively in microwave test systems for signal routing between instruments and Device under Test (DUT).
RF and Microwave switches are used extensively in microwave test systems for signal routing between instruments and Device Under Test (DUT). Incorporating a switch into a switch matrix system enables you to route signals from multiple instruments to single or multiple DUTs. This allows multiple tests to be performed with the same setup, eliminating the need for frequent connects and disconnects. The entire testing process can be automated, increasing the throughput in high-volume production environments.
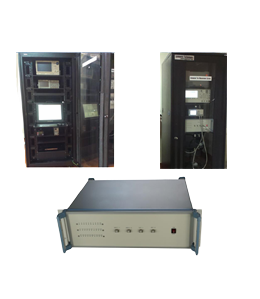
The Automated Test and Measurement system (ATMS) is a test and characterization for testing microwave tubes, transmitters, etc., under different mode of operation. This facility basically aimed for characterization of both DC and RF measurements of device under test both at discrete frequencies and as well as sweep frequencies. The test facility is faster, repeatable, error free, less human intervention and less time. The facility is having access to retrieve the measured data of interest as and when required in simpler method. It is capable of identifying the fault and recording the fault as and when it occurs at the time of testing, is adaptable to any type of instruments of both RF and Non-RF type. The software for controlling and monitoring the parameters is Lab-View. The measurements and operations are controlled by Automation Software using personal computer.
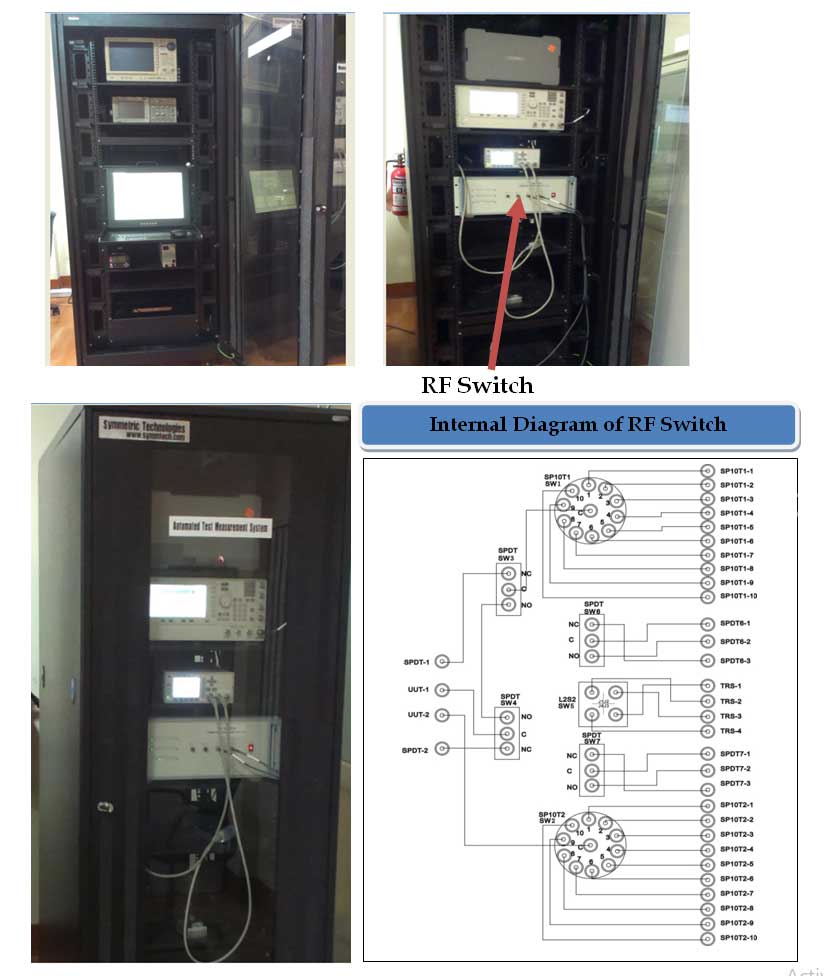
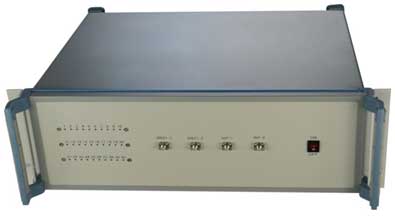
All the RF instruments are connected to LAN and DUT is connected for communicating with any of the equipment under LAN. All controlling and monitoring parameters are through the LAN. The DUT is connected to the two SMA connectors which are provided in RF-Switch matrix. RF switch is a device to route high frequency signal through transmission path. The Non-RF part of the system is independently controlled and monitored by the software through USB-GPIB interface provided in the equipments.
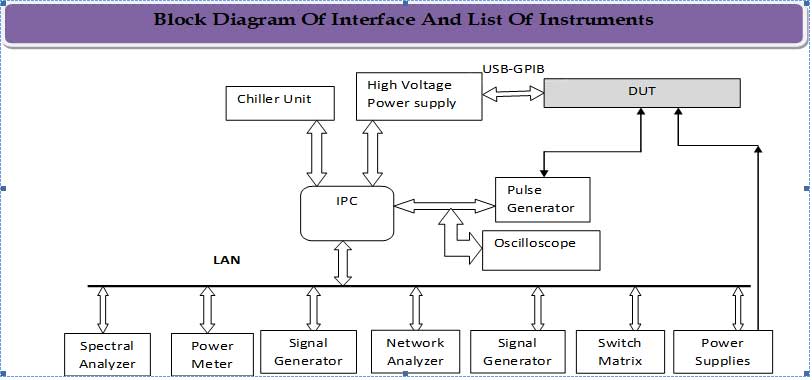
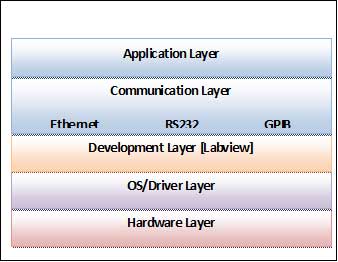
ATMS Software will allow the user to configure the measuring instruments (RF and Non-RF), device under test (DUT), read the test inputs from the device under test, develop test, control, and measure the ATMS test applications, and it will displays a measuring output in a output screen. The software controlling and monitor both RF and Non-RF parameters by LABVIEW. And it is a Graphics User Interface (GUI) based program, it'll acts as an interface between user and the measuring instruments.
ATMS Software is capable of handshaking with instruments of both RF and non-RF type though LAN/GPIB/RS232C interfaces that will be provided on the instruments/equipments. The communication with various equipments is takes place as per the required operation and a provision for necessary time delay is provided that can be set and adjust as per the user requirements for sending and receiving the data and also to perform the desired measurements.
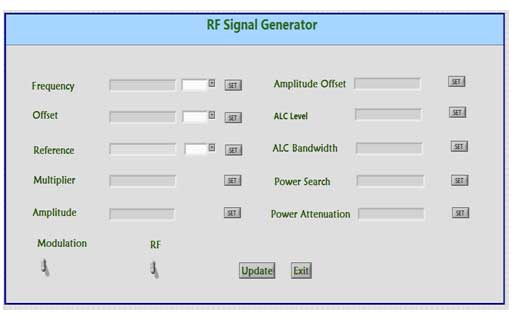
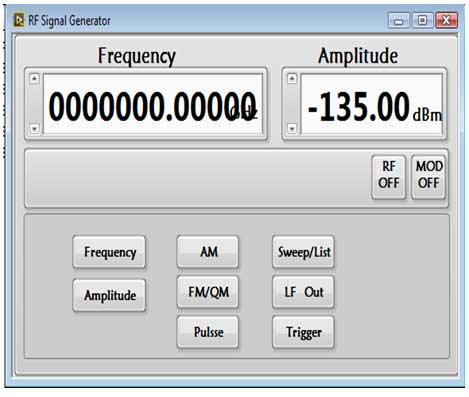
In this RF Signal Generator Programming if we press update button it will read all the measurement values like Frequency, Offset, Reference, Multiplier, Amplitude, ALC Level, ALC Bandwidth, Power search and Power attenuation. If we want to set the values for Frequency, Offset and all other measurements we can use SET buttons.
| SL. No | Items | Qty. |
| 1. | Single Board Computer | 1 No. |
| 2. | RF Switch Matrix with SMA(F) Square Flange mounted connectors on RF switch Matrix, RF Cable Assemblies, Connectors(SMA(A)) along with Cables | 1 Set |
| 3. | GUI based Software Development and Testing and Integration | 1 Set |
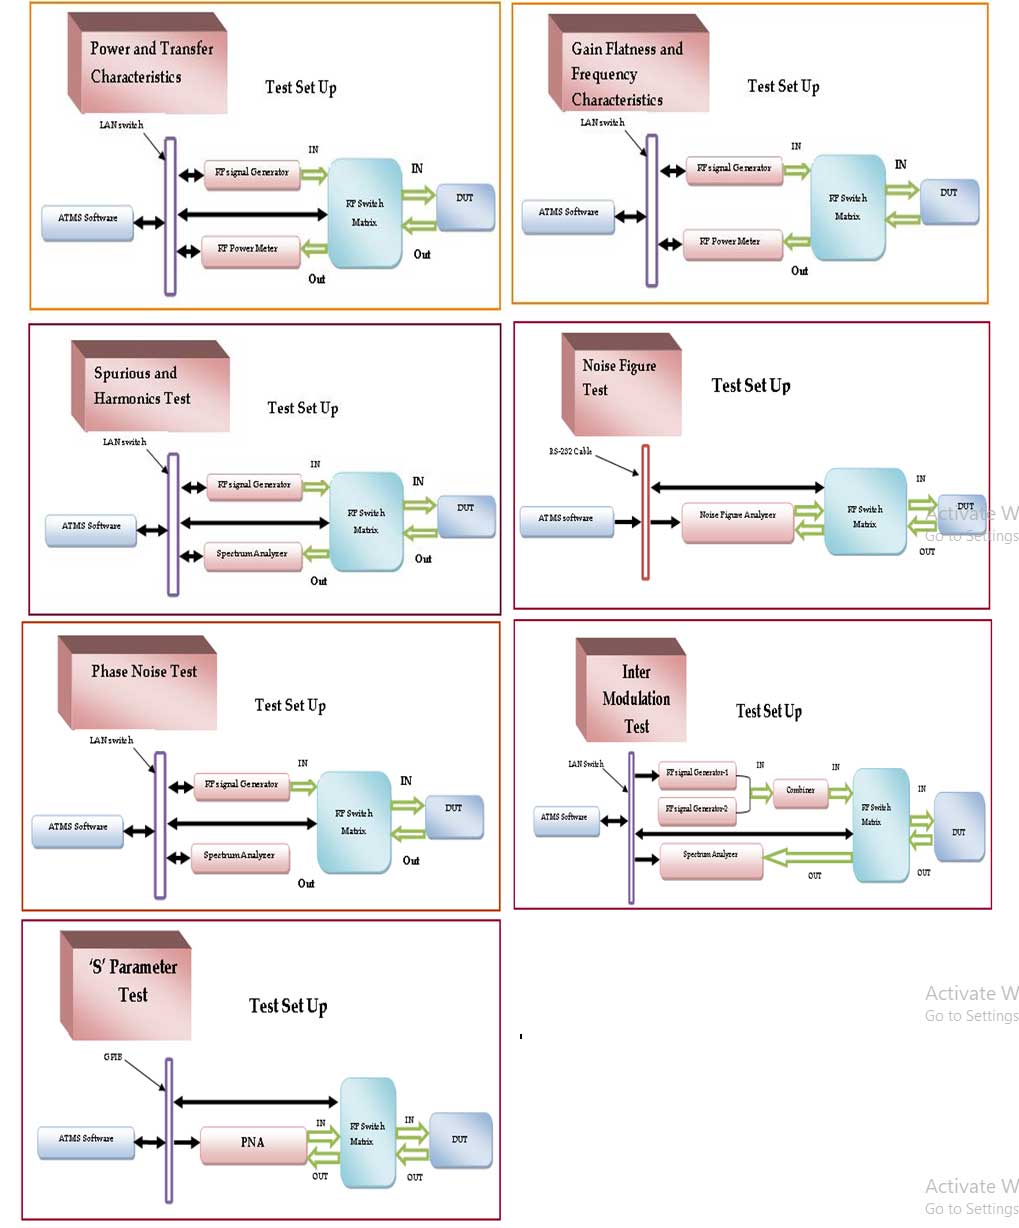
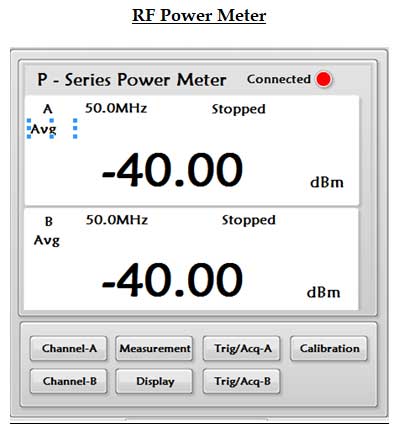
The input from RF Signal Generator is given to the RF Switch and the output from RF Switch is connected to one of the sensors of RF Power Meter.
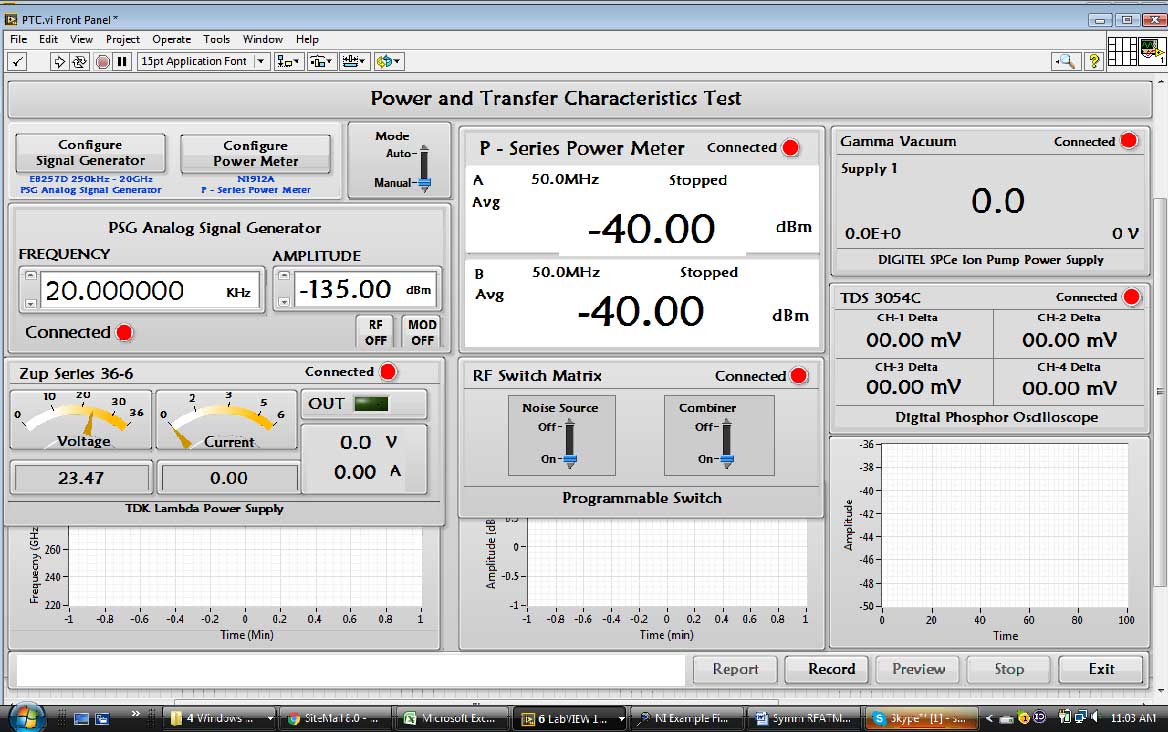
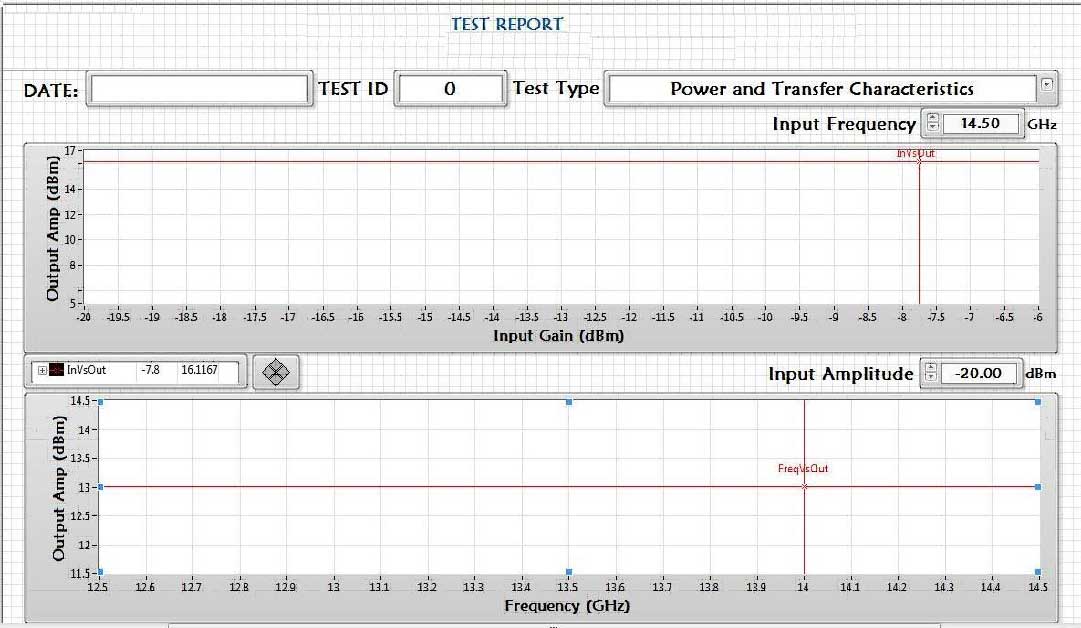
In this test case user can change frequency and amplitude values from RF Signal Generator and we can read the corresponding Output Power from the RF Power Meter. Through Record option user can record the data and recorded data can be saved in the form of xl sheet. Using this data user can generate the report along with the plot graphs Input Power Vs Output Power and Frequency Vs Gain.
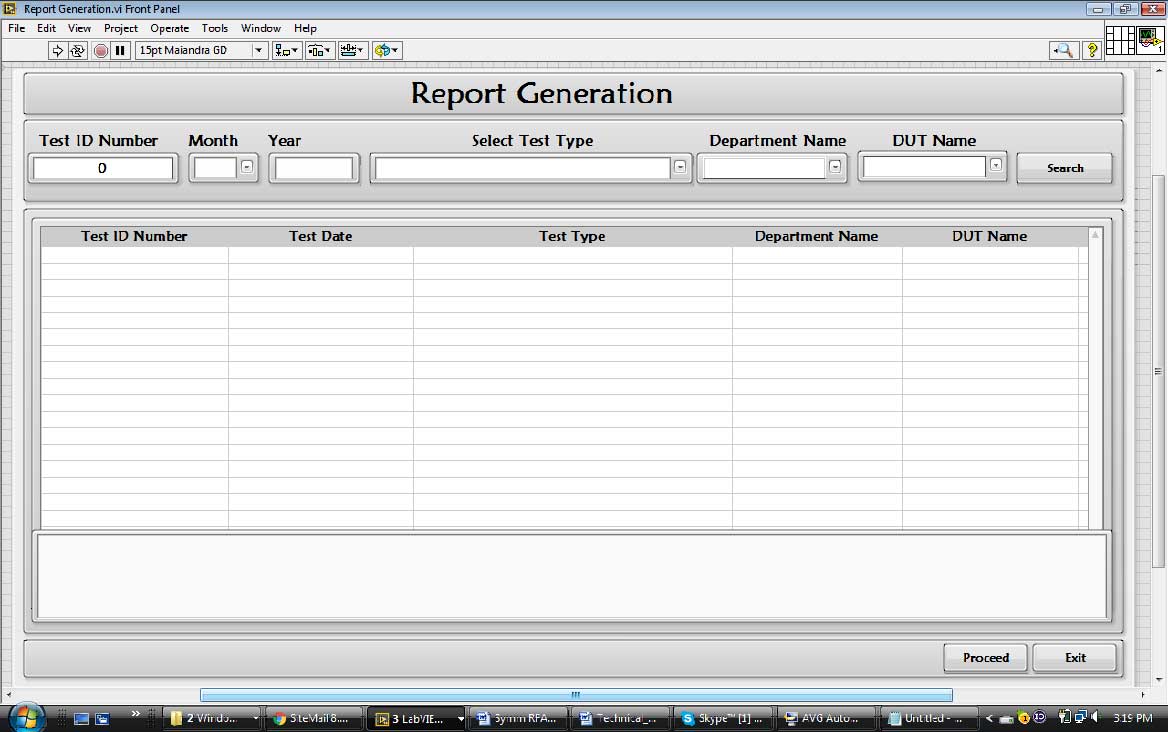
Through above page we can search the recorded data based on Test ID Number, Month, Year, Test Type Department Name and DUT Name. After search it will display all the information related to particular test
We can generate above test report using the data stored in xl sheet, with all the graphs.
The input from RF Signal Generator is given to the RF Switch and the output from RF Switch is connected to one of the sensors of RF Power Meter.

In this Test case RF signal Generator is connected to the i/p port of the RF Switch Matrix and Power Meter is connected to the o/p port of the RF Switch Matrix.DUT is connected between RF Switch Matrix and RF Power Meter. RF Signal Generator, RF power Meter and Switch Matrix are connected to the ATMS Software through LAN communication. Through this s/w Frequency and Amplitude values of Signal Generator can be set and this is given as i/p to the Switch Matrix and o/p can be read through RF power Meter and displayed through the Software.
Software option shall be provided to enter the bandwidth and frequency based on that gain flatness in linear mode and saturation mode shall be calculated and Frequency Vs Gain graph can be plotted automatically through the software.
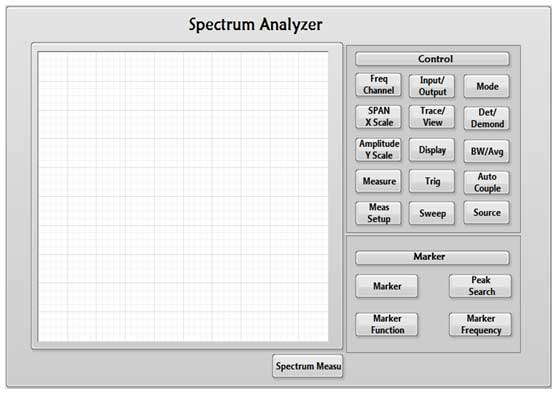
The input from RF Signal Generator is given to the RF Switch and the output from RF Switch is connected Spectrum Analyzer
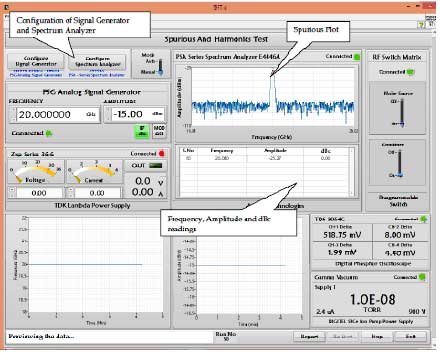
In this Test case RF signal Generator is connected to the i/p port of the RF Switch Matrix and Spectrum Analyzer is connected to the o/p port of the RF Switch Matrix.DUT is connected between RF Switch Matrix and Spectrum Analyzer. RF Signal Generator, Spectrum Analyzer and Switch Matrix are connected to the ATMS Software through LAN communication. Through ATMS S/W Frequency values of Signal Generator can be set and this is given as i/p to the Switch Matrix and o/p can be read from Spectrum Analyzer and highest spurious value can be measured by the ATMS S/w and indicates in the graph
In this Test case user can set the Frequency and Amplitude values through RF Signal generator automatically finds the carrier levels measures the data and plots the Frequency Vs Amplitude graph
The input from RF Signal Generator is given to the RF Switch and the output from RF Switch is connected Spectrum Analyzer
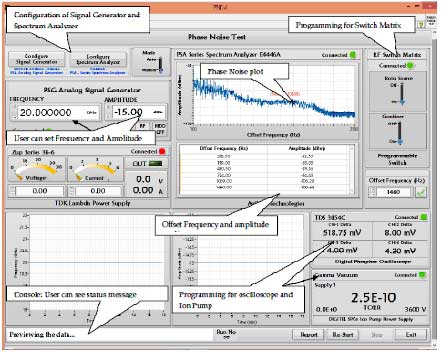
In this Test case RF signal Generator is connected to the i/p port of the RF Switch Matrix and Spectrum Analyzer is connected to the o/p port of the RF Switch Matrix.DUT is connected between RF Switch Matrix and Spectrum Analyzer. RF Signal Generator, Spectrum Analyzer and Switch Matrix are connected to the ATMS Software through LAN communication. Through this s/w Frequency values of Signal Generator can be set and this is given as i/p to the Switch Matrix and o/p can be read from Spectrum Analyzer and Phase Noise measurement can be done by the ATMS S/w and indicates in the graph.
In this Test case user can set the Frequency and Amplitude values through RF Signal generator and S/W automatically measures the Phase Noise for different offset f
The input from Noise Source sensor is given as input to the RF Switch and the output from RF Switch is connected Noise Figure Analyzer.
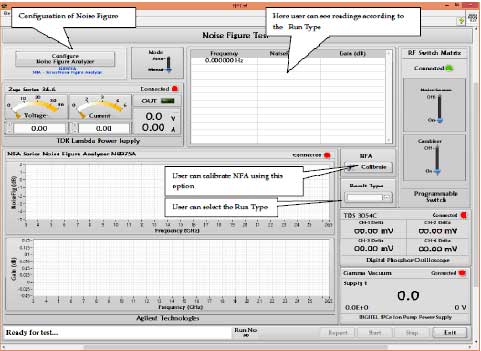
In this Test case Noise Figure Analyzer is connected to the i/p port of the RF Switch Matrix and Noise Sensor is connected to the o/p port of the RF Switch Matrix.DUT is connected between Noise Figure Analyzer and Noise sensor. Noise Figure Analyzer and Noise Sensor are connected to the ATMS S/W through Serial Communication and Switch Matrix is connected to the ATMS Software through LAN communication. Through this s/w select the Result Type in Noise Figure Analyzer and read the data from Noise Figure Analyzer and display the data.
Based on the selected Result Type like Noise Figure, P -Hot, T-Cold etc.. S/w automatically updates Frequency, Result Type and gain Values and also plots Frequency Vs result Type and Frequency Vs gain graphs
In this Test case, RF Signal Generator-1 and RF Signal Generator-2 are given as input to the combiner, Combiner is connected to the input port of RF Switch and Spectrum Analyzer is connected to the output port of RF Switch.
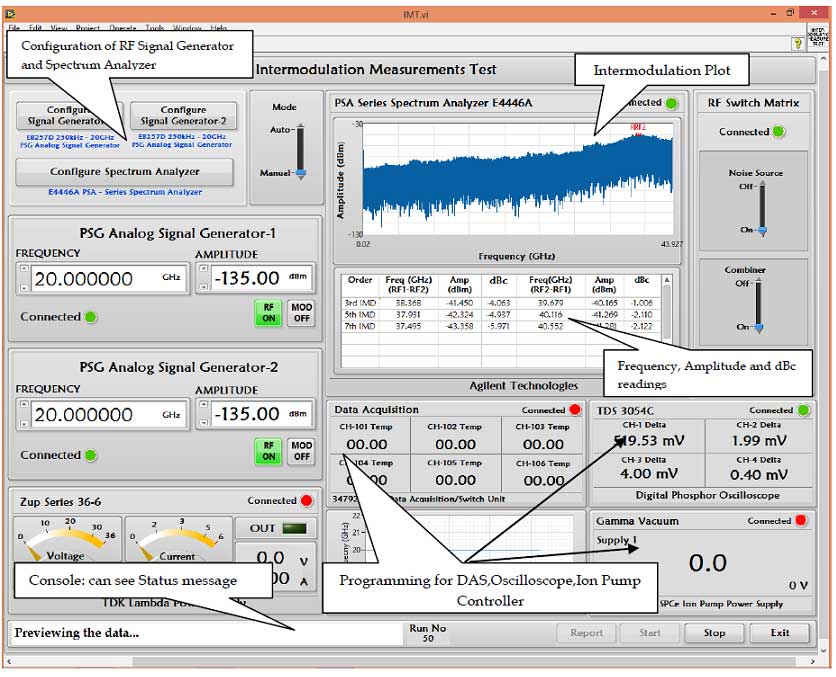
In this both the RF Signal Generators are connected to combiner, combiner o/p is given as i/p to the RF Switch Matrix and Spectrum Analyzer is connected to the o/p port of the RF Switch Matrix..DUT is connected between RF Switch Matrix and Spectrum Analyzer. RF Signal Generators, Spectrum Analyzer and Switch Matrix are connected to the ATMS Software through LAN communication. Through this s/w Frequency values of Signal Generators can be set and this is given as i/p to the Switch Matrix and o/p can be read from Spectrum Analyzer and Harmonics measurement can be done by the ATMS S/w and indicates in the graph. In this Test case user can set the Frequency and Amplitude values through RF Signal Generator-1 and RF Signal Generator-2 and S/w automatically finds the Harmonics at the inter modulated Frequency and updated the 3rd,5th and 7th order IMD Frequency, Amplitude and dBc values and also plot the graph Frequency Vs Amplitude.
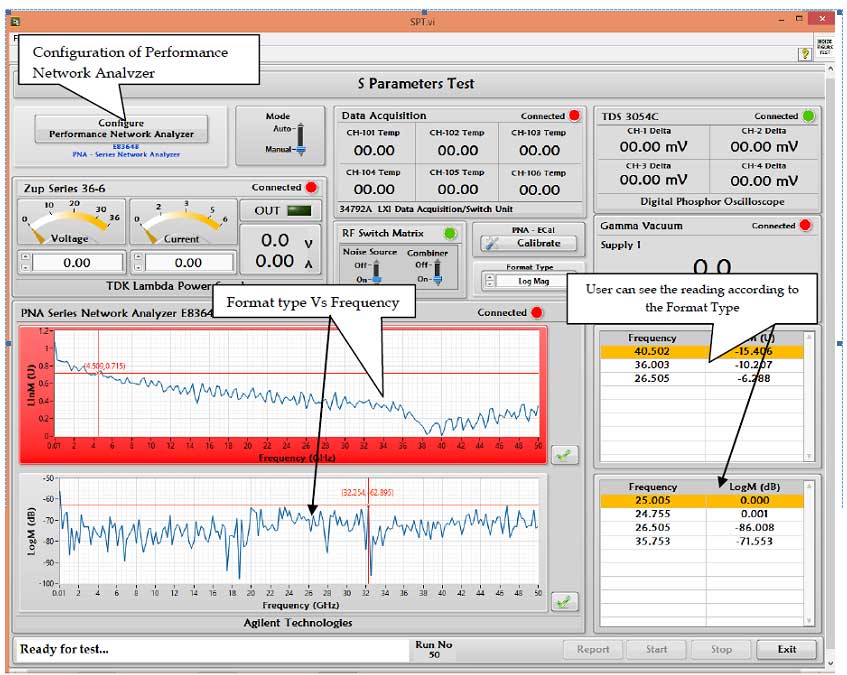
In this Test case PNA is connected to the i/p port of the RF Switch Matrix and Power Meter is connected to the DUT.DUT is connected back to the PNA. PNA and RF Switch Matrix are connected to the ATMS Software through LAN communication. Through this s/w format type can be selected and corresponding data can be read from PNA and displayed through the Software.
Software option shall be provided to select the Format Type through Performance Network Analyzer, based on the selected Format Type software automatically updates Frequency, and Format Type Values and also plots Frequency Vs Format Type graph.